A data warehouse for ChatGPT and Claude. Connect your ads, your store and any other tool from the chat. We keep the history and correct it when a platform revises.
An assistant chat: asked for a dashboard for a Shopify store and Meta ads, it reads both synced sources through Reportslayer, builds the dashboard and draws it in the reply: four KPIs, revenue by day and ad spend by channel. It expands to fullscreen, or opens in Reportslayer to change it by hand.
Northwind dashboard
Build me a dashboard for my ads and store data
Shopify, Meta, Google and TikTok are already synced with full history. I'll set up a dashboard.
catalogsources Meta, Google, TikTok, Shopify
get metricsrevenue, ad_spend, last 30 days 30 rows
builddashboard "Northwind Goods" 8 widgets
Done. Northwind Goods has revenue, orders, ad spend and blended ROAS up top, then revenue against ad spend by day, spend by channel and your top products. It
refreshes after every sync.
Northwind GoodsSep 1 to 30, 2026
Revenue +12.4% $184,320 +12.4%
Orders +8.1% 2,431 +8.1%
Ad spend +18.2% $60,400 +18.2%
Blended ROAS −4.9% 3.05x −4.9%
Revenue by day and ad spend by channel, Sep 1 to 30 Open in Reportslayer
Reply...
+
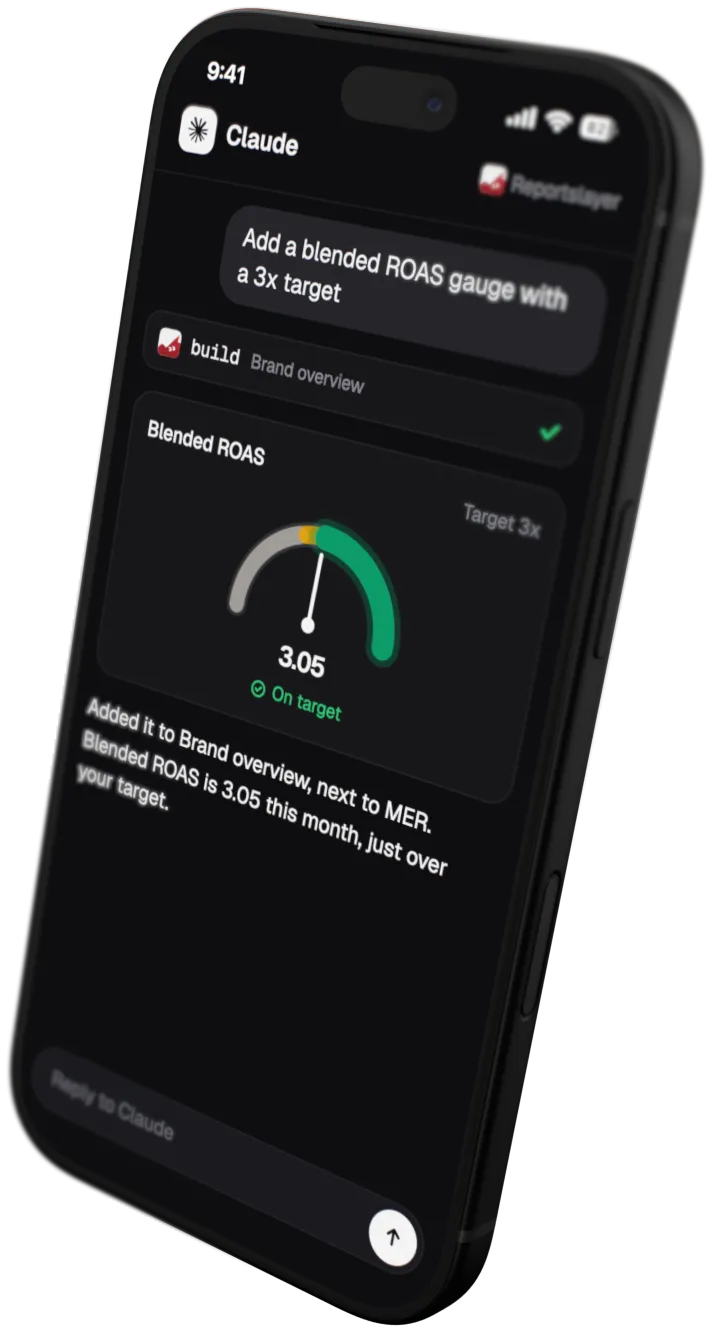
The same dashboard in edit mode in Reportslayer: a ROAS gauge with a 3x target is selected with its settings open, and a revenue progress widget with its month-end pace is being dragged in.
Northwind Goods
Unsaved changes
Add chart
CancelSave
ChannelAnyCampaignAny
Viewers change filters for themselves.
Revenue
$184,320
Orders
2,431
Ad spend
$60,400
Blended ROAS
3.05
Revenue and ad spend
Blended ROAS
Target 3x
3.05
Progress
$184,320 of $200,000
Month-end pace
Top products
Merino Crew Sweater $39,396
Canvas Weekender $27,260
Linen Overshirt $23,088
Revenue target
Ad spend by channel
Meta Ads 68%
Google Ads 21%
TikTok Ads 10%
Campaigns
The Northwind Goods dashboard in Reportslayer: a warning banner that blended ROAS is under 3x this week, then revenue, orders, ad spend and blended ROAS, revenue against ad spend by day, ad spend by channel, top products and revenue by channel. Example data.
Northwind GoodsPublic link
Revenue by day and ad spend by channel, Sep 1 to 30
Continue in ChatGPT / ClaudeSharePublic linkapp.reportslayer.com/p/n7xk2 Customize
We plugged the Meta and Shopify MCPs into ChatGPT and Claude to run
our own numbers. Every Monday the assistant pulled everything again
and came back with a different ROAS. The dashboard it drew lived in
that one chat.
The clankers are good at the math. They have nowhere to keep the data,
so we built that part. You get:
A warehouse for every source you connect. We run the sync.
History that catches late changes, like Meta purchases and Shopify refunds
Metrics across sources, like margin from Shopify sales minus your COGS sheet
Dashboards on their own link, refreshed after every sync
Supermetrics charges $55 a month for three sources and keeps the warehouse for its Enterprise plan.
Ours is free up to 10K events a month, then $29 a workspace.
Proudly built in Boston 🇺🇸 and Helsinki 🇫🇮
Karri KoivuniemiCo-founder, Reportslayer and Commslayer
A data warehouse for ChatGPT and Claude
A platform MCP fetches one answer and the data dies with the chat.
Add a forecast for our contribution margin for next year.
get metrics12 rows
build1 widget
Done. The forecast is on your Northwind Goods dashboard: about $840K for the next 12 months if the 14.0% growth of the last 12 holds. It refreshes after every sync.
Contribution margin forecast
Last 12 months $737,026 +14.0%
Next 12 months $840,210
$120k $80k $40k $0
Oct Dec Jan Feb Apr Jun Jul Aug
Sample data
A full BI tool, built in
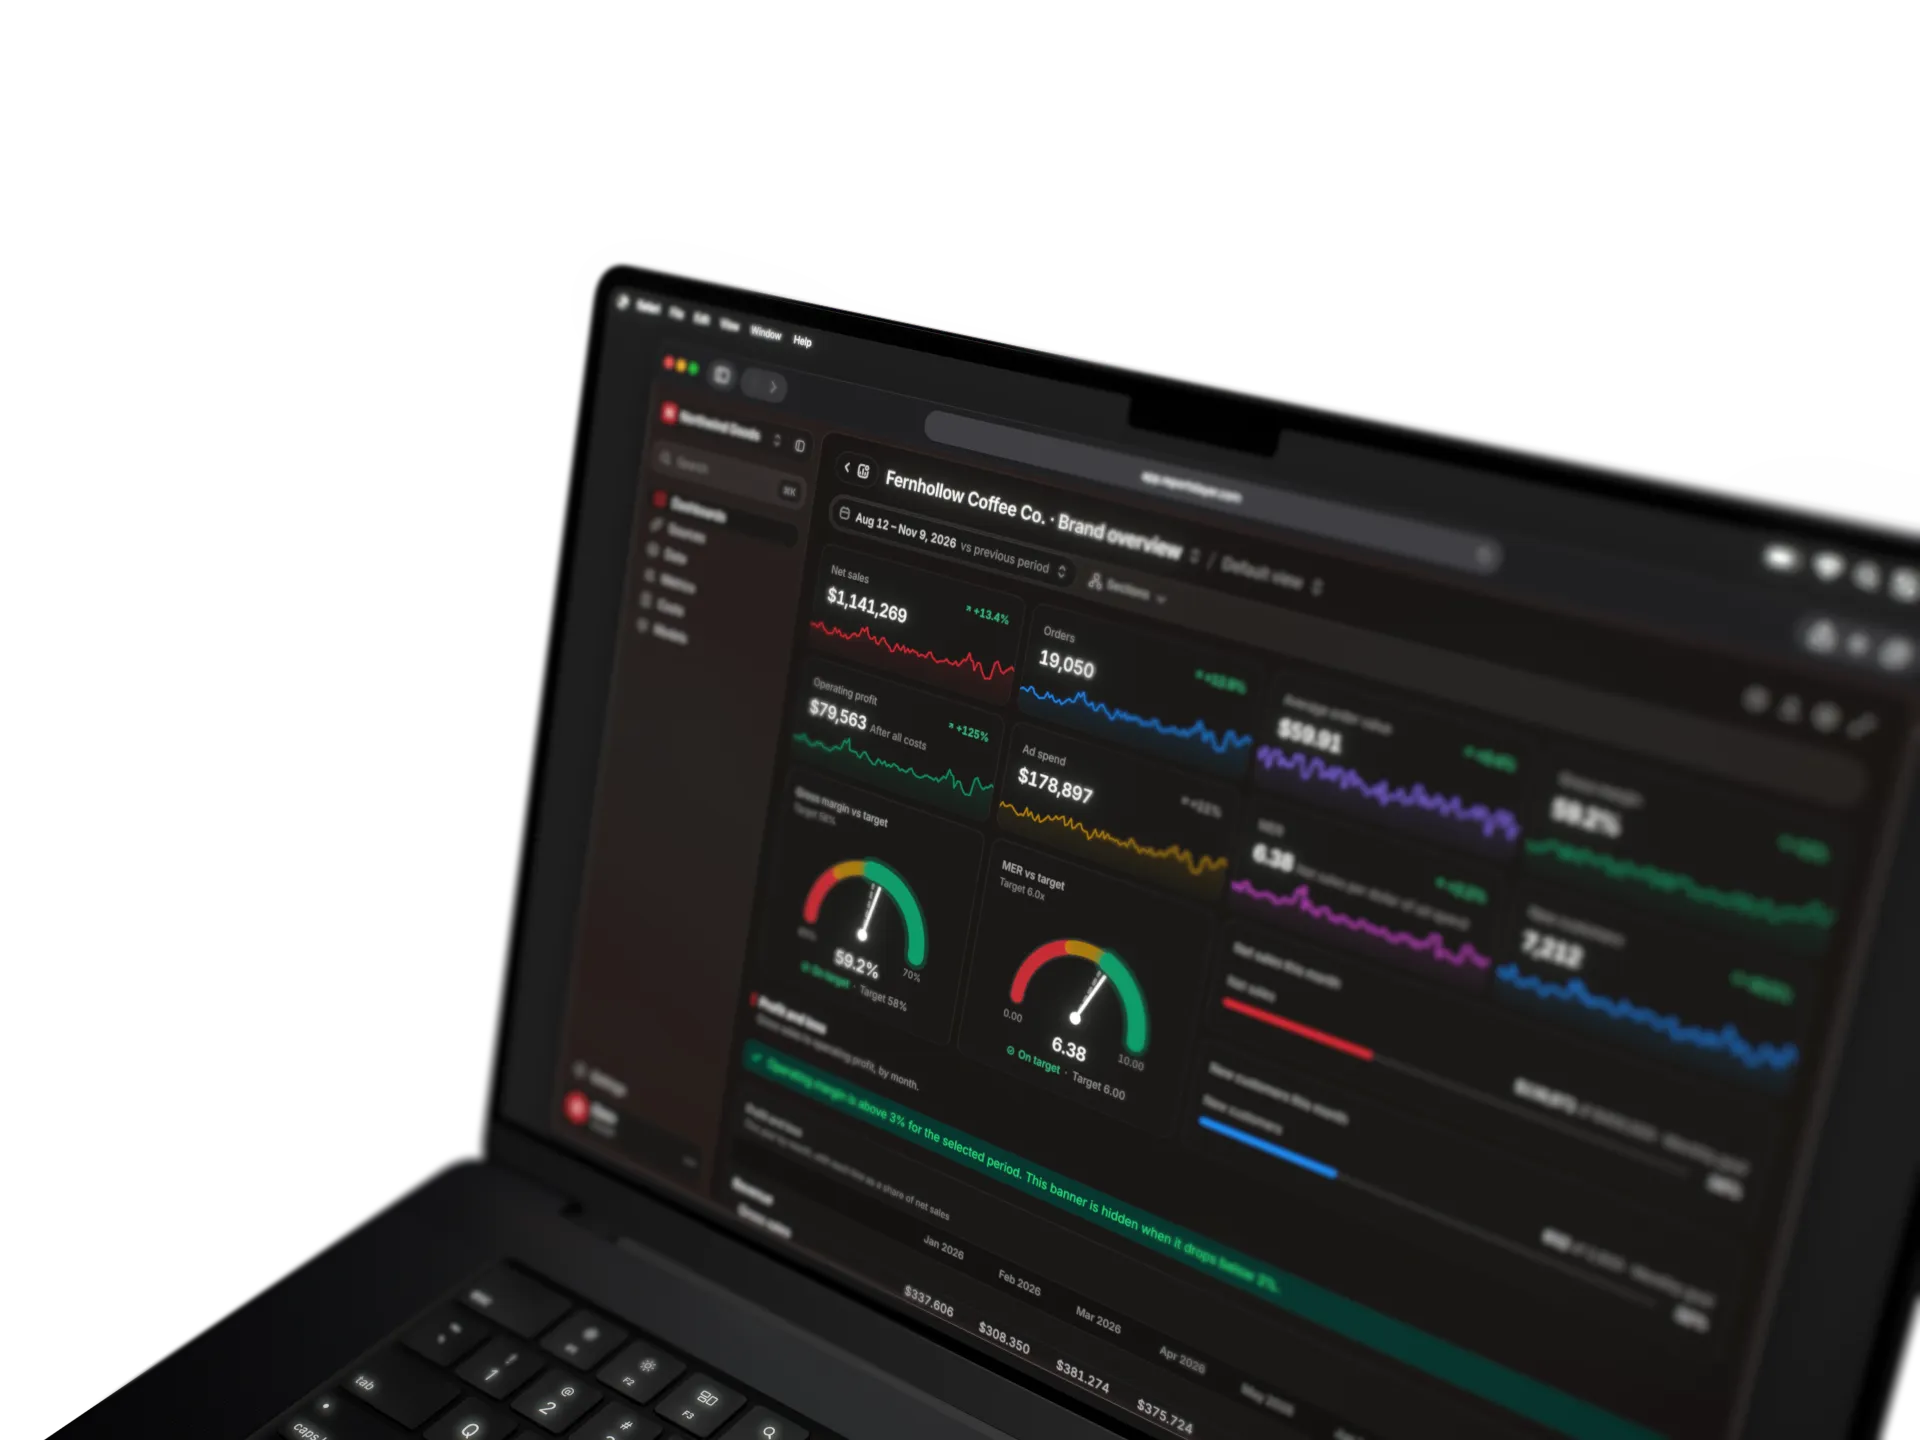
A copy of our Fernhollow Coffee Co. demo board, with sample data for a
made-up brand: eight stats with their daily trend, two target gauges, two
monthly goals and the start of a profit and loss statement by month.
DBDemo boardsFernhollow Coffee Co. · Demo brand overview
View only
Jul 15 – Oct 12, 2026vs previous period
Sections
Fernhollow Coffee Co.
Sells coffee, subscriptions and brew gear through its online store, Shop, TikTok Shop and a shop counter.
Net sales
+5.8%
$1,070,724
Orders
+5.4%
17,905
Average order value
+0.3%
$59.8
Gross margin
+1.3%
59%
Operating profit
+66.7%
$57,030 After all costs
Ad spend
+5.6%
$170,095
MER
+0.1%
6.29 Net sales per dollar of ad spend
New customers
+1.1%
6,955
Gross margin vs target
Target 58%
45% 70%
59%
On target
· Target 58%
MER vs target
Target 6.0x
0.00 10.00
6.29
On target
· Target 6.00
Net sales this month
Net sales $149,002
of $400,000
· Monthly goal
37%
New customers this month
New customers 938
of 2,600
· Monthly goal
36%
Profit and loss
Gross sales to operating profit, by month.
Profit and loss
This year by month, with each line as a share of net sales
A copy of our Rookwell demo board, with sample data for a made-up B2B SaaS company: five stats, MRR by month with the trend carried forward, MRR by plan, MRR movement by month and by quarter, a monthly goal, a target gauge and the top customers by MRR, then product usage: active accounts and users, usage events by week, feature adoption, and usage next to revenue by account.
RORookwellRookwell · Demo SaaS overview
View only
Jul 16 – Oct 13, 2026vs previous period
Sections
Rookwell
Job scheduling and invoicing software for trade contractors. Subscriptions billed through Stripe.
MRR is above $100K. This banner shows for as long as it stays there.
MRR
+15.1%
$121,653
Net new MRR
+15.6%
$15,940
Paying customers
+14.3%
152
ARPA
+0.7%
$800.35 Per customer
MRR churn rate
0.9%
Last 30 days, target under 1.5%
MRR by month
Last 12 months, with the recent trend carried forward
A copy of our Ironvale Fleet demo client report, with sample data for a made-up fleet leasing company: the agency's notes, four monthly targets, five stats with their daily trend, daily leads against the previous period, cost per lead against its target, spend by platform, and tables of platforms and campaigns.
IFIronvale FleetIronvale Fleet · Demo client report
View only
Sep 14 – Oct 13, 2026vs previous period
Sections
Ironvale Fleet · client report
Prepared by Saltmarsh Digital. Lead generation across Google, Meta and LinkedIn, pipeline from the CRM and organic search.
Notes from Saltmarsh Digital · LinkedIn leads cost about three times what Meta leads do, but sales qualifies almost half of them against one in five on Meta. We plan to move a tenth of the Meta prospecting budget to LinkedIn in November. Google cost per lead is holding steady around $65. Next up: a new landing page for truck and HGV leasing, and electric van creative on Meta.
This month against targets
Leads 219
of 520
· Monthly target
42%
Qualified leads 77
of 185
· Monthly target
42%
Pipeline created $620,484
of $1,500,000
· Monthly target
A copy of our Mosslight Apps demo board, with sample data for a made-up Shopify app studio: five stats with their daily trend, MRR by month with the trend carried forward, MRR by plan, MRR movement by month and by quarter, and the top shops by app revenue.
MAMosslight AppsMosslight Apps · Demo app revenue
View only
Sep 14 – Oct 13, 2026vs previous period
Sections
Mosslight Apps
A two-person Shopify app studio with two apps, Mosslight Bundles and Mosslight Preorders. Same shape as the data from a Shopify Partner organization.
MRR
+8.4%
$12,439
Net new MRR
+18.3%
$962
Paying shops
+4.6%
181
ARPU
+3.6%
$68.72 Per paying shop
App earnings
+10.3%
$13,657 After fees
MRR by month
Last 12 months, with the recent trend carried forward
$20K $15K $10K $5K $0
OctJanAprJulOctJan
MRR by plan
$12.4K MRR
Bundles Pro $199 $4,975 40%
Bundles Growth $79 $3,950 32%
Preorders Plus $59 $1,534 12%
Bundles Starter $29 $1,334 11%
Preorders Basic $19 $646 5%
MRR movement by month
Added MRR above zero, lost MRR below
New
Expansion
Reactivated
Contraction
Churned
$2K $1K $0 −$1K
Oct Nov Dec Jan Feb Mar Apr May Jun Jul Aug Sep
MRR movement
This year by quarter
Line
Q1 2026
Q2 2026
Q3 2026
Q4 2026 to Oct 13
Starting MRR
$7,900
$8,637
$9,542
$11,963
New MRR
$1,321
$1,340
$2,515
$544
Expansion MRR
$530
$670
$540
$40
Reactivation MRR
$19
$19
$59
$0
Contraction MRR
−$100
−$170
−$100
$0
Churned MRR
−$1,033
−$954
−$593
−$108
Net new MRR
$737
$905
$2,421
$476
Ending MRR
$8,637
$9,542
$11,963
$12,439
Top shops by revenue
App revenue in the period, with MRR and usage charges
How is this different from running the Meta or Shopify MCP in a chat?
The Meta or Shopify MCP only reads its own platform and doesn't keep any history. Reportslayer syncs 24 sources into one warehouse behind one plugin. You can ask for blended ROAS across all your ad platforms in a single question. Because we store the history, last week's numbers are still there next week.
Can't Claude just spin up a warehouse with one prompt?
It can create a database and load one export, but nothing keeps that copy current. Keeping it current takes scheduled pulls from every API, a history backfill, token refreshes and rate limit handling. It also has to re-read recent days, because ad platforms revise their numbers for weeks and orders get edited or refunded later. SQL written against raw rows scans everything for each question, so we store daily totals, keep one definition per metric and put a limit on every query. Pro costs $29 a month per workspace, and Free covers up to 10K events a month.
Isn't this just storage and a few templates?
No. Storage is one part of it. A sync engine pulls every source on a schedule and re-reads the days a platform revises. A metric layer gives each number one definition, which the dashboards and your assistant both use. Each dashboard is a hosted page with its own link. Time zones and currencies match across sources. Free covers 10K events a month, and Pro is $29 a month per workspace.
Can I build a P&L?
Yes. Connect Shopify and Meta. Product cost comes from Shopify's cost per item or the cost you set per SKU, and payment fees come from Shopify. Ad spend comes from your ad accounts. You add your shipping rates. Ask for a P&L by month and you get gross profit, contribution margin and net profit, with last year next to each month. A restocked return gives its product cost back.
Can my assistant change my ads or anything else I connect?
No. We only read data from the sources you connect. Your assistant can edit your Reportslayer dashboards and metrics. If you want it to look without changing anything, give it read-only access.
Can it alert me when a number crosses a threshold?
Yes. Ask your assistant to set an alert, and we email you when a metric crosses the threshold you pick. We check every hour and send one email each time it crosses. Your assistant can also schedule a dashboard's headline numbers and top rows to your inbox daily, weekly or monthly.
Will my data fit in 10K events?
It depends on how many rows you sync in a month. An event is one row we sync or you push in: one ad's stats for a day, one CRM deal, one payment, one order, one sheet row. The first backfill of a connector never counts toward your events. Only the rows synced after it do. Reading or querying your data doesn't count. If you hit the cap, syncing pauses until next month. You are never billed.
Do I have to pay to try it?
No. Every new account starts with a 14-day Pro trial, with full history and syncs every hour. When the trial ends, you move to Free. Nothing is billed unless you choose to pay.
Do I need a paid ChatGPT or Claude plan?
It depends on your assistant's plan. Some ChatGPT and Claude plans limit plugins and custom MCP servers, so check what yours includes. Reportslayer doesn't charge for the assistant side. You can also build dashboards by drag and drop and share them by link without any assistant.
Do I pay per seat?
No. Connectors, accounts, dashboards, metrics, viewers and seats are unlimited on both plans. You can invite your whole team, and your clients too if you run an agency.
My tool isn't listed. Can I still connect it?
Yes, if it has an API. Ask ChatGPT or Claude to connect it, and your assistant writes the connection from the tool's API docs. You paste the key on a secure Reportslayer page. The data lands in tables of its own and joins your other sources. For a database with no API, push its rows from a script.
What did you cut?
We don't have a tracking pixel or attribution, and there is no built-in AI chat. We also don't query your own database or export to Data Studio, Sheets or BigQuery. You can keep Triple Whale or Polar for attribution and run everything else here.
Do you have agents that tell me what to do next on ads, conversion and costs?
No. There is no built-in agent or AI chat. You use ChatGPT or Claude on your own plan with your own instructions, and the tokens go on your own bill. We handle the data side. We keep every source synced and give each metric one definition. Your agent starts from the correct revenue and margin, in results sized to fit a chat reply.
Vibe your first dashboard
Add the plugin, connect your sources and ask for a dashboard. Your Monday export won't make it.