All your store data in one layer .
Your own metrics on top.
A data warehouse for ChatGPT and Claude. Connect Shopify and your ad accounts from the chat, and your product costs and fees come with them. Ask for a P&L by month.
Connect +16 more
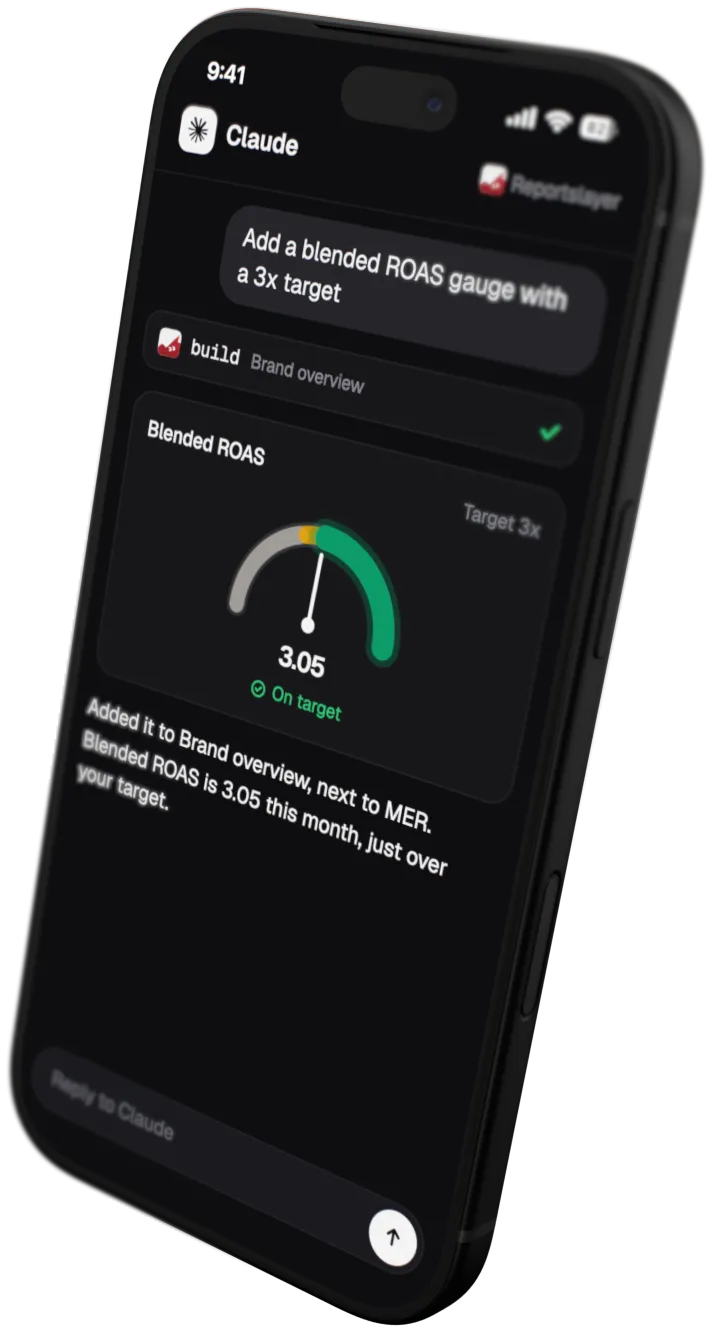
An assistant chat: asked for a dashboard for a Shopify store and Meta ads, it reads both synced sources through Reportslayer, builds the dashboard and draws it in the reply: four KPIs, revenue by day and ad spend by channel. It expands to fullscreen, or opens in Reportslayer to change it by hand.

The same dashboard in edit mode in Reportslayer: a ROAS gauge with a 3x target is selected with its settings open, and a revenue progress widget with its month-end pace is being dragged in.
The Northwind Goods dashboard in Reportslayer: a warning banner that blended ROAS is under 3x this week, then revenue, orders, ad spend and blended ROAS, revenue against ad spend by day, ad spend by channel, top products and revenue by channel. Example data.
One warehouse for the store, the ads and the books
Shopify is a connector we already have: connect it and the Store dashboard is built while your order history syncs.
Syncs every source into one warehouse
Each source backfills as far as its API allows, then syncs on a schedule. We handle rate limits and expired tokens. Connect a source and its first dashboard is built while the history loads.
15 starter dashboards, from profit and paid ads to subscriptions, support and cash.
Warehouse
- shopify_orders Synced just now
- meta_ads_daily
- google_ads_daily
- influencer_payouts
Store Starter dashboard
- Revenue $184,320
- Orders 2,431
- AOV $75.82
Warehouse
- shopify_orders
- meta_ads_daily Synced just now
- google_ads_daily
- influencer_payouts
Paid ads Starter dashboard
- Spend $41,200
- Clicks 52,810
- CPC $0.78
Warehouse
- shopify_orders
- meta_ads_daily
- google_ads_daily Synced just now
- influencer_payouts
Paid ads Starter dashboard
- Spend $12,900
- Clicks 18,430
- CPC $0.70
Warehouse
- shopify_orders
- meta_ads_daily
- google_ads_daily
- influencer_payouts Imported
-
Answers a year of data in one reply
Your assistant asks for a metric by name instead of writing its own SQL. Twelve months come back as twelve rows.
-
Lays out a P&L by month
Revenue runs down to gross profit, contribution margin and net profit, with months across and last year beside them. Start from a preset: Store profit and loss, App profit and loss, MRR movement, Support by month or Marketing by month.
-
Hosts every dashboard on its own link
Your assistant places the widgets. The page gets its own link and keeps refreshing after you close the chat.
-
Keeps your numbers right
Meta attributes purchases late and Shopify orders get edited or refunded. Each sync picks up those changes and updates the days they touch.
The work happens in the chat
Connect a source, save a metric or move a widget by asking. The page outlives the chat.
-
Save contribution margin once, as revenue minus COGS and ad spend, and every dashboard and reply reads that one definition.
-
Push in what Shopify doesn't have, wholesale orders by API from your ERP, and your 3PL's invoices as a CSV.
-
Drag it around, or ask, every setting on the grid also works from the chat, and asking a new question adds a widget.
-
Share with the team, one link with an optional password, and viewers pick their own dates and filters.
A full BI tool, built in
15 widget kinds, from stat tiles to P&L statements. Compare periods, set monthly targets, and let viewers pick their own dates and filters.
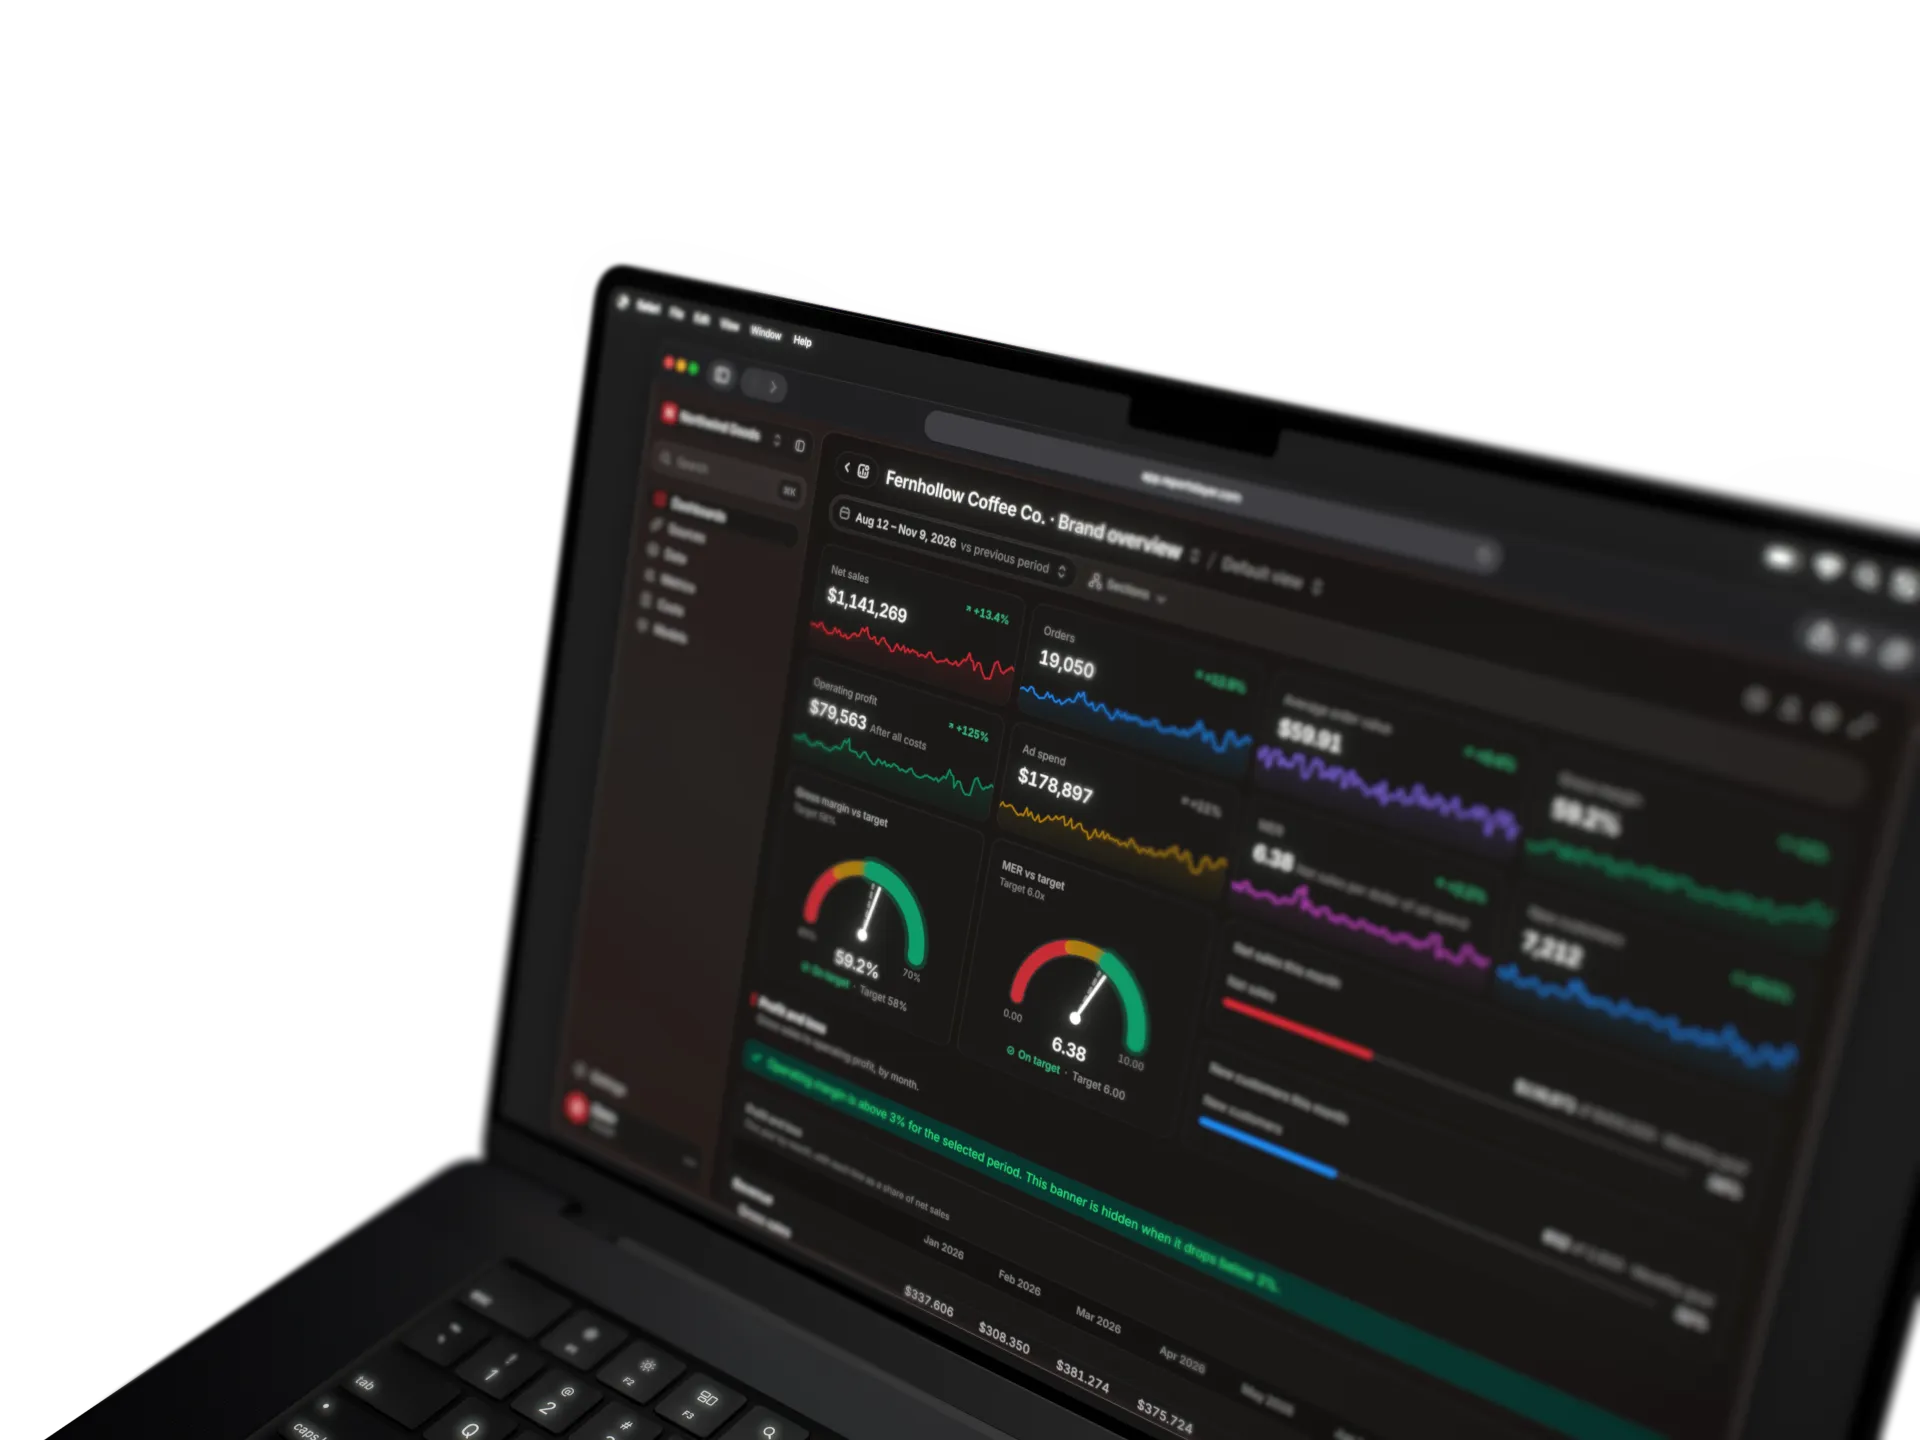
A copy of our Fernhollow Coffee Co. demo board, with sample data for a made-up brand: eight stats with their daily trend, two target gauges, two monthly goals and the start of a profit and loss statement by month.
A copy of our Rookwell demo board, with sample data for a made-up B2B SaaS company: five stats, MRR by month with the trend carried forward, MRR by plan, MRR movement by month and by quarter, a monthly goal, a target gauge and the top customers by MRR, then product usage: active accounts and users, usage events by week, feature adoption, and usage next to revenue by account.
A copy of our Ironvale Fleet demo client report, with sample data for a made-up fleet leasing company: the agency's notes, four monthly targets, five stats with their daily trend, daily leads against the previous period, cost per lead against its target, spend by platform, and tables of platforms and campaigns.
A copy of our Mosslight Apps demo board, with sample data for a made-up Shopify app studio: five stats with their daily trend, MRR by month with the trend carried forward, MRR by plan, MRR movement by month and by quarter, and the top shops by app revenue.
Show every widget and option Show fewer
-
Stat
One number with its trend and change.
-
Line
A metric over time, against the period before.
-
Bar
Categories compared, stacked or side by side.
-
Donut
Parts of a whole.
-
Gauge
A number against its target zones.
-
Statement
Metrics as rows and months as columns, like a P&L.
-
Progress
How far along each target is, with month-end pace.
-
Podium
The top three.
-
Table
Rows and columns.
-
Section
A title and a line of context.
-
Group
A card that keeps widgets together.
-
Text
Notes in plain words.
-
Banner
Info, success, warning or critical, shown on a condition.
-
Divider
A line between parts.
-
Spacer
Breathing room in the grid.
- Compare
- Previous periodPrevious year
- Time grain
- DayWeekMonthQuarterYearFiscalRetail 4-5-4
- Filters
- Any dimensionViewer-side filters and datesDrill by clicking
- Breakdown
- Split byTop NOther
- Targets
- MonthlyZonesMonth-end pace
- Colours
- PaletteShadesPer row
- Formats
- CurrencyPercentRatioDuration
Leave the dirty work to us
The plumbing a platform MCP doesn't have, run by us.
The stack you'd build around BigQuery, run by us.
A one-off export misses every later refund and every revised ad number.
Compare with
With Reportslayer
The platform MCPs on their own Your own BigQuery Vibe-coded by your assistant
-
You get your own warehouse.
Reportslayer
Synced rows sit in a warehouse we host, and every question you ask reads from there.
The platform MCPs on their own
Each call returns one answer, and nothing is kept once the reply is written.
-
Last quarter is never pulled again.
Reportslayer
The first sync pulls the longest history each API allows. After that we sync on a schedule, every hour on Pro and every 6 hours on Free.
The platform MCPs on their own
You get the rows that fit in one answer, and they are fetched again the next time you ask.
-
Your past numbers catch up by themselves.
Reportslayer
We re-read Meta's recent days every sync and update any that moved. A Shopify order edited or refunded is picked up next sync, however old it is.
The platform MCPs on their own
Last week's ROAS sits in a chat transcript, frozen at the moment you asked.
-
Spend and orders sit in one warehouse.
Reportslayer
We store each source in the same warehouse, by day, so Meta spend can be divided by Shopify orders in one question.
The platform MCPs on their own
Two tools return two shapes, lined up differently in each reply.
-
Your metrics mean one thing everywhere.
Reportslayer
You define contribution margin once. The dashboard widget and the assistant run that same definition.
The platform MCPs on their own
Contribution margin is defined in the prompt, so the next chat can define it differently.
-
Your days line up.
Reportslayer
Meta, Google and Commslayer days are moved onto your workspace's time zone, so Tuesday's spend divides Tuesday's orders.
The platform MCPs on their own
Days arrive as each platform counts them, and nothing lines them up for you.
-
Your assistant never sees a customer's email.
Reportslayer
Customer names and emails are masked by default and hidden from SQL and from your assistant. An owner can unmask them for people in the app.
The platform MCPs on their own
Whatever fields the platform returns land in the chat transcript.
-
One plan covers the whole stack.
Reportslayer
Connectors, warehouse, metric layer and dashboards come on one plan, and we keep them running.
Your own BigQuery
BigQuery is the warehouse. Connectors, a metric layer and dashboards are each bought or built, and someone keeps them running.
-
The build and upkeep are in the price.
Reportslayer
Free up to 10K events a month. Pro is $29 a month per workspace with 100K events, and the build and the upkeep are in the price.
Your own BigQuery
Google's own bill is close to $0 while your data is small, and it grows with what your queries read. The larger cost is the connector tool and the hours of whoever builds and maintains it.
-
Your past numbers catch up by themselves.
Reportslayer
A Shopify order edited or refunded is picked up next sync, however old it is. We re-read Meta's recent days at least once a day.
Your own BigQuery
A maintained connector re-reads changed orders too. A one-off export, or a pipeline nobody watches, keeps the numbers from the day it ran.
-
Your metrics mean one thing everywhere.
Reportslayer
You define contribution margin once. The dashboard widget and the assistant run that same definition.
Your own BigQuery
Only if someone builds a metric layer on top, for the dashboard and the assistant both.
-
Your assistant's queries stay fast.
Reportslayer
Your assistant asks for a metric and we answer it from data that's already summed up. It doesn't write its own query across millions of order rows and customer records.
Your own BigQuery
The assistant writes its own SQL against the raw tables. One clumsy query reads every row, and BigQuery bills for every row it reads.
-
Your dashboards get built in the chat.
Reportslayer
Ask for a dashboard and your assistant places the widgets, with no chart to configure by hand. Each dashboard lives on its own link.
Your own BigQuery
A separate tool, such as Data Studio, where someone builds each report on tables they modelled first.
-
Your own numbers sit beside the synced ones.
Reportslayer
Upload a CSV, link a Google Sheet or push rows, then join them to your synced data. A statement widget lays out the P&L.
Your own BigQuery
SQL joins anything. Someone loads the file, writes the join and keeps it working.
-
Your sources keep syncing by themselves.
Reportslayer
Every source is pulled on a schedule, with a backfill of history, token refreshes, rate limits and re-reads of recent days.
Vibe-coded by your assistant
A script that ran once, with no schedule, backfill or retry.
-
Your metrics mean one thing everywhere.
Reportslayer
ROAS is defined once, summed before it is divided, and the dashboards and the assistant both run that definition.
Vibe-coded by your assistant
Each prompt defines the metric its own way.
-
Your assistant's queries stay fast.
Reportslayer
Your assistant asks for a metric by name and we answer from stored totals, with limits on every query.
Vibe-coded by your assistant
SQL runs over raw rows with no stored totals or limits.
-
Your dashboards stay open after the chat.
Reportslayer
Each dashboard is a page on its own link that refreshes after every sync.
Vibe-coded by your assistant
The chart lives inside one chat.
-
It costs less than building your own.
Reportslayer
Free up to 10K events a month, then $29 a month per workspace, with the sync and its upkeep included.
Vibe-coded by your assistant
You pay in the hours to build and maintain it.

Frequently asked questions
Can't Claude just spin up a warehouse with one prompt?
It can create the database and load a first export, but that copy won't update itself. Ad platforms revise their numbers for weeks, and orders get edited or refunded long after they were placed. That means a warehouse has to re-read past days on every sync, on top of scheduled pulls, token refreshes and rate limits for each API. Reportslayer runs that sync engine for $29 a month per workspace, or free up to 10K events a month. That is less than the hours it takes to build the first connector.
We already have Triple Whale. Does this replace it?
Yes, for everything except attribution. Triple Whale has its own pixel on your store and we don't, so keep it for that. Your dashboards and P&L run here, built from Shopify and Amazon Seller Central orders, ad spend, your books in Xero and your product and shipping costs. Saras Analytics starts at $1,999 a month on its plan for Shopify brands, and Pro here is $29 a month per workspace.
Don't Shopify's reports already show margin?
Yes, they show gross profit on Shopify orders, based on the cost per item saved on each variant. Reportslayer keeps those orders in one warehouse with Amazon Seller Central orders, Loop Subscriptions revenue and what each ad platform charged. It takes shipping and payment fees off each Shopify order, so one statement runs from gross sales through contribution margin to net profit.
Will my data fit in 10K events?
It depends on how many rows you sync in a month. An event is one row we sync or you push in: one ad's stats for a day, one CRM deal, one payment, one order, one sheet row. The first backfill of a connector never counts toward your events. Only the rows synced after it do. Reading or querying your data doesn't count. If you hit the cap, syncing pauses until next month. You are never billed.
Can my assistant change my ads or anything else I connect?
No. We only read data from the sources you connect. Your assistant can edit your Reportslayer dashboards and metrics. If you want it to look without changing anything, give it read-only access.
Can it alert me when a number crosses a threshold?
Yes. Ask your assistant to set an alert, and we email you when a metric crosses the threshold you pick. We check every hour and send one email each time it crosses. Your assistant can also schedule a dashboard's headline numbers and top rows to your inbox daily, weekly or monthly.
Do I have to pay to try it?
No. Every new account starts with a 14-day Pro trial, with full history and syncs every hour. When the trial ends, you move to Free. Nothing is billed unless you choose to pay.

Never log into a reporting tool again
Connect Shopify and your ad accounts from the chat, and your first dashboards are built while the history syncs.
- Free plan with every feature
- 10K events a month on Free
- Unlimited seats, viewers and dashboards
- Pro is month to month